Jump to content

Edit History

musicmaster

musicmaster

Ajax is a technique where a javascript file running on your page is calling some php routine that returns a value that is then processed to change your page. A good example is the modules page. When you enable or disable a module the page is not refreshed yet after some time you see a popup telling you that the operation succeeded. To achieve this your page calls in the background another page that when finished returns the result. 

From the point of view of the user this has the advantage that he stays on the page. But for the webshop owner debugging his pages this poses some challenges as everything happens in the background. The new way of error reporting in PS 1.7 offers some help compared to PS 1.6. But it can still be a challenge to find out what is going wrong.

When things go well the background call returns some result that can be understood by the foreground page. But when something goes wrong the foreground page often is not possible to interpret the result. That results in messages like  "jqHXR error",  "Unexpected token < in JSON at position 0" or "TECHNICALERROR : unable to save carrier Details:Error  thrown: [object Object] Text status: parsererror". Some  people talk about json errors. But only a minority of the ajax calls returns data in the json format.

The trick to understand the error is to have a look yourself at what the background task returned. That can be done in the Network tab in the browser console. 

In the following I assume that you have debug mode (_PS_MODE_DEV_) enabled.

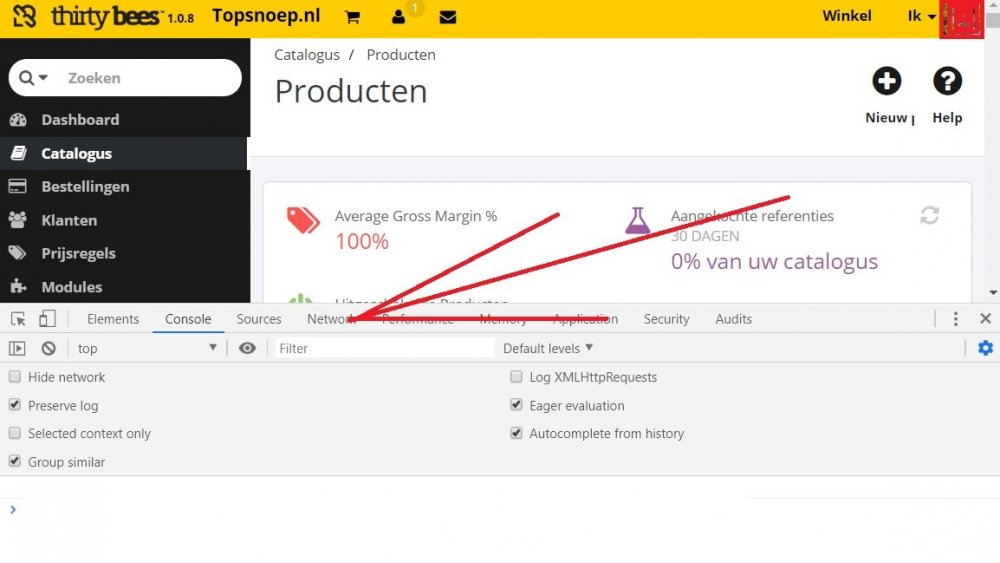
In Chrome you can open the browser console by pressing F12. In other browsers things may look a bit different but generally they have the same functionality. After you open the console your screen looks like the following:


ajax1.thumb.jpg.f80bbaddda92065b14c56ab04b04413c.jpg

The bottom part of your window is now the "console" and standard the "console" where you can see javascript errors is opened.

For what we are doing now however you need the fourth tab: Network. When you open that you get something like this:

ajax2.thumb.jpg.a7832c2dd9ece8c6cfb8ab69ca0ebd94.jpg

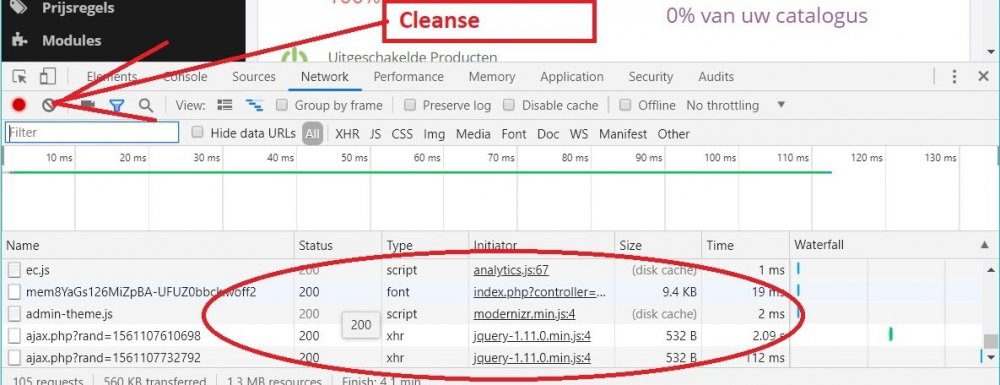
In the lower half you see now a list of files that have been opened. Note that Chrome only starts collecting this list after you opened the console. So initially it may be empty for you. But when you start browsing in the top half of the screen you will see filling it soon enough. Note also the button with which you can empty this window.

The ajax.php?rand= calls are keep alive calls that can be conveniently be ignored.

As an example I used the adding of an image to a product. The selection of the image does nothing. But when you press the Upload button an ajax call is made. In the console it looks like this:

ajax3.thumb.jpg.2d976b298d02f466c418da7a92aef747.jpg

The first line is the ajax call. We can see more details by clicking on the file name ("index.php?....").

ajax4.thumb.jpg.efc92ac409f6a9a9ad1762e97e2e5c1d.jpg

Now a submenu appears. Standard it is opened at the Response tab. As you see in this case the response is in json format.

For more information you can click on the Header tab:

ajax5.jpg.da0de897836afeaac8fa231dbc3fd909.jpg

A lot of information appears. When you scroll a lot down you see what is shown here: the query parameters. When you click on View Source you will see the string of the query.

In my final picture I show what happens when an error occurs. In this case I have edited the file AdminProductController.php so that it produces an error. You get then the following:

ajax6.thumb.jpg.07674614e54f71165ef47d3b278e2479.jpg

In view of this it is quite understandable that the json parser produces an error about an unexpected "<" at position 0.

What you see here is the output of php files that are run. So they will include filenames and line numbers. And that will help you a lot more solving problems then the vague errors produced by javascript after the failed ajax calls.

Often you can find much of this information from the error logs of your server. But that takes more work. And not everyone knows where his logs are. In contrast this works always.

Some versions produce do not produce simple error messages like shown above but instead a html formatted page that contains the error information. These are very hard to read in the browser console. What you can do is to copy this whole formatted text, put it into a new html file and look at it in a browser.

musicmaster

musicmaster

Ajax is a technique where a javascript file running on your page is calling some php routine that returns a value that is then processed to change your page. From the point of view of the user this has the advantage that he stays on the page. But for the webshop owner debugging his pages this poses some challenges as everything happens in the background. The new way of error reporting in PS 1.7 offers some help compared to PS 1.6. But it can still be a challenge to find out what is going wrong.

Ajax calls that go wrong appear in different forms. Sometimes you see a "jqHXR error". Sometimes you get a message like "Unexpected token < in JSON at position 0". And sometimes it looks like "TECHNICALERROR : unable to save carrier Details:Error  thrown: [object Object] Text status: parsererror". Some  people talk about json errors. But only a minority of the ajax calls returns data in the json format.

In the following I assume that you have debug mode (_PS_MODE_DEV_) enabled.

To see what is going wrong you need to open the browser console. In Chrome this is done by pressing F12. In other browsers things may look a bit different but generally they have the same functionality. After you open the console your screen looks like the following:


ajax1.thumb.jpg.f80bbaddda92065b14c56ab04b04413c.jpg

The bottom part of your window is now the "console" and standard the "console" where you can see javascript errors is opened.

For what we are doing now however you need the fourth tab: Network. When you open that you get something like this:

ajax2.thumb.jpg.a7832c2dd9ece8c6cfb8ab69ca0ebd94.jpg

In the lower half you see now a list of files that have been opened. Note that Chrome only starts collecting this list after you opened the console. So initially it may be empty for you. But when you start browsing in the top half of the screen you will see filling it soon enough. Note also the button with which you can empty this window.

The ajax.php?rand= calls are keep alive calls that can be conveniently be ignored.

As an example I used the adding of an image to a product. The selection of the image does nothing. But when you press the Upload button an ajax call is made. In the console it looks like this:

ajax3.thumb.jpg.2d976b298d02f466c418da7a92aef747.jpg

The first line is the ajax call. We can see more details by clicking on the file name ("index.php?....").

ajax4.thumb.jpg.efc92ac409f6a9a9ad1762e97e2e5c1d.jpg

Now a submenu appears. Standard it is opened at the Response tab. As you see in this case the response is in json format.

For more information you can click on the Header tab:

ajax5.jpg.da0de897836afeaac8fa231dbc3fd909.jpg

A lot of information appears. When you scroll a lot down you see what is shown here: the query parameters. When you click on View Source you will see the string of the query.

In my final picture I show what happens when an error occurs. In this case I have edited the file AdminProductController.php so that it produces an error. You get then the following:

ajax6.thumb.jpg.07674614e54f71165ef47d3b278e2479.jpg

In view of this it is quite understandable that the json parser produces an error about an unexpected "<" at position 0.

What you see here is the output of php files that are run. So they will include filenames and line numbers. And that will help you a lot more solving problems then the vague errors produced by javascript after the failed ajax calls.

Often you can find much of this information from the error logs of your server. But that takes more work. And not everyone knows where his logs are. In contrast this works always.

Some versions produce do not produce simple error messages like shown above but instead a html formatted page that contains the error information. These are very hard to read in the browser console. What you can do is to copy this whole formatted text, put it into a new html file and look at it in a browser.
musicmaster

musicmaster

Ajax is a technique where a javascript file running on your page is calling some php routine that returns a value that is then processed to change your page. From the point of view of the user this has the advantage that he stays on the page. But for the webshop owner debugging his pages this poses some challenges as everything happens in the background. The new way of error reporting in PS 1.7 offers some help compared to PS 1.6. But it can still be a challenge to find out what is going wrong.

Ajax calls that go wrong appear in different forms. Sometimes you see a "jqHXR error". Sometimes you get a message like "Unexpected token < in JSON at position 0". And sometimes it looks like "TECHNICALERROR : unable to save carrier Details:Error  thrown: [object Object] Text status: parsererror". Some  people talk about json errors. But only a minority of the ajax calls returns data in the json format.

In the following I assume that you have debug mode (_PS_MODE_DEV_) enabled.

To see what is going wrong you need to open the browser console. In Chrome this is done by pressing F12. In other browsers things may look a bit different but generally they have the same functionality. After you open the console your screen looks like the following:


ajax1.thumb.jpg.f80bbaddda92065b14c56ab04b04413c.jpg

The bottom part of your window is now the "console" and standard the "console" where you can see javascript errors is opened.

For what we are doing now however you need the fourth tab: Network. When you open that you get something like this:

ajax2.thumb.jpg.a7832c2dd9ece8c6cfb8ab69ca0ebd94.jpg

In the lower half you see now a list of files that have been opened. Note that Chrome only starts collecting this list after you opened the console. So initially it may be empty for you. But when you start browsing in the top half of the screen you will see filling it soon enough. Note also the button with which you can empty this window.

The ajax.php?rand= calls are keep alive calls that can be conveniently be ignored.

As an example I used the adding of an image to a product. The selection of the image does nothing. But when you press the Upload button an ajax call is made. In the console it looks like this:

ajax3.thumb.jpg.2d976b298d02f466c418da7a92aef747.jpg

The first line is the ajax call. We can see more details by clicking on the file name ("index.php?....").

ajax4.thumb.jpg.efc92ac409f6a9a9ad1762e97e2e5c1d.jpg

Now a submenu appears. Standard it is opened at the Response tab. As you see in this case the response is in json format.

For more information you can click on the Header tab:

ajax5.jpg.da0de897836afeaac8fa231dbc3fd909.jpg

A lot of information appears. When you scroll a lot down you see what is shown here: the query parameters. When you click on View Source you will see the string of the query.

In my final picture I show what happens when an error occurs. In this case I have edited the file AdminProductController.php so that it produces an error. You get then the following:

ajax6.thumb.jpg.07674614e54f71165ef47d3b278e2479.jpg

In view of this it is quite understandable that the json parser produces an error about an unexpected "<" at position 0.

What you see here is the output of php files that are run. So they will include filenames and line numbers. And that will help you a lot more solving problems then the vague errors produced by javascript after the failed ajax calls.

Often you can find much of this information from the error logs of your server. But that takes more work. And not everyone knows where his logs are. In contrast this works always.

musicmaster

musicmaster

Ajax is a technique where a javascript file running on your page is calling some php routine that returns a value that is then processed to change your page. From the point of view of the user this has the advantage that he stays on the page. But for the webshop owner debugging his pages this poses some challenges as everything happens in the background. The new way of error reporting in PS 1.7 offers some help compared to PS 1.6. But it can still be a challenge to find out what is going wrong.

Ajax calls that go wrong appear in different forms. Sometimes you see a "jqHXR error". Sometimes you get a message like "Unexpected token < in JSON at position 0". And sometimes it looks like "TECHNICALERROR : unable to save carrier Details:Error  thrown: [object Object] Text status: parsererror". Some  people talk about json errors. But only a minority of the ajax calls returns data in the json format.

In the following I assume that you have debug mode (_PS_MODE_DEV_) enabled.

To see what is going wrong you need to open the browser console. In Chrome this is done by pressing F12. In other browsers things may look a bit different but generally they have the same functionality. After you open the console your screen looks like the following:


ajax1.thumb.jpg.f80bbaddda92065b14c56ab04b04413c.jpg

The bottom part of your window is now the "console" and standard the "console" where you can see javascript errors is opened.

For what we are doing now however you need the fourth tab: Network. When you open that you get something like this:

ajax2.thumb.jpg.a7832c2dd9ece8c6cfb8ab69ca0ebd94.jpg

In the lower half you see now a list of files that have been opened. Note that Chrome only starts collecting this list after you opened the console. So initially it may be empty for you. But when you start browsing in the top half of the screen you will see filling it soon enough. Note also the button with which you can empty this window.

The ajax.php?rand= calls are keep alive calls that can be conveniently be ignored.

As an example I used the adding of an image to a product. The selection of the image does nothing. But when you press the Upload button an ajax call is made. In the console it looks like this:

ajax3.thumb.jpg.2d976b298d02f466c418da7a92aef747.jpg

The first line is the ajax call. We can see more details by clicking on the file name ("index.php?....").

ajax4.thumb.jpg.efc92ac409f6a9a9ad1762e97e2e5c1d.jpg

Now a submenu appears. Standard it is opened at the Response tab. As you see in this case the response is in json format.

For more information you can click on the Header tab:

ajax5.jpg.da0de897836afeaac8fa231dbc3fd909.jpg

A lot of information appears. When you scroll a lot down you see what is shown here: the query parameters. When you click on View Source you will see the string of the query.

In my final picture I show what happens when an error occurs. In this case I have edited the file AdminProductController.php so that it produces an error. You get then the following:

ajax6.thumb.jpg.07674614e54f71165ef47d3b278e2479.jpg

In view of this it is quite understandable that the json parser produces an error about an unexpected "<" at position 0.

What you see here is the output of php files that are run. So they will include filenames and line numbers. And that will help you a lot more solving problems then the vague errors produced by javascript after the failed ajax calls.


musicmaster

musicmaster

Ajax is a technique where a javascript file running on your page is calling some php routine that returns a value that is then processed to change your page. From the point of view of the user this has the advantage that he stays on the page. But for the webshop owner debugging his pages this poses some challenges as everything happens in the background. The new way of error reporting in PS 1.7 offers some help compared to PS 1.6. But it can still be a challenge to find out what is going wrong.

Ajax calls that go wrong appear in different forms. Sometimes you see a "jqHXR error". Sometimes you get a message like "Unexpected token < in JSON at position 0". And sometimes it looks like "TECHNICALERROR : unable to save carrier Details:Error  thrown: [object Object] Text status: parsererror". Some  people talk about json errors. But only a minority of the ajax calls returns data in the json format.

In the following I assume that you have debug mode (_PS_MODE_DEV_) enabled.

To see what is going wrong you need to open the browser console. In Chrome this is done by pressing F12. In other browsers things may look a bit different but generally they have the same functionality. After you open the console your screen looks like the following:


ajax1.thumb.jpg.f80bbaddda92065b14c56ab04b04413c.jpg

The bottom part of your window is now the "console" and standard the "console" where you can see javascript errors is opened.

For what we are doing now however you need the fourth tab: Network. When you open that you get something like this:

ajax2.thumb.jpg.a7832c2dd9ece8c6cfb8ab69ca0ebd94.jpg

In the lower half you see now a list of files that have been opened. Note that Chrome only starts collecting this list after you opened the console. So initially it may be empty for you. But when you start browsing in the top half of the screen you will see filling it soon enough. Note also the button with which you can empty this window.

The ajax.php?rand= calls are keep alive calls that can be conveniently be ignored.

As an example I used the adding of an image to a product. The selection of the image does nothing. But when you press the Upload button an ajax call is made. In the console it looks like this:

ajax3.thumb.jpg.2d976b298d02f466c418da7a92aef747.jpg

The first line is the ajax call. We can see more details by clicking on the file name ("index.php?....").

ajax4.thumb.jpg.efc92ac409f6a9a9ad1762e97e2e5c1d.jpg

Now a submenu appears. Standard it is opened at the Response tab. As you see in this case the response is in json format.

For more information you can click on the Header tab:

ajax5.jpg.da0de897836afeaac8fa231dbc3fd909.jpg

A lot of information appears. When you scroll a lot down you see what is shown here: the query parameters. When you click on View Source you will see the string of the query.

In my final picture I show what happens when an error occurs. In this case I have edited the file AdminProductController.php so that it produces an error. You get then the following:

ajax6.thumb.jpg.07674614e54f71165ef47d3b278e2479.jpg

In view of this it is quite understandable that the json parser produces an error about an unexpected "<" at position 0.

What you see here is the output of php files that are run. So they will include filenames and line numbers. And that will help you a lot more solving problems then the vague errors produced by javascript after the failed ajax calls.


×
×
  • Create New...